Narrowboat Telemetry
In this post, I’m going to explain how I developed and deployed a telemetry system on the narrowboat, in order to track a number of useful things all in a simple to use, unified and remotely accessible inferface. Do note that this is going to be a very technical post - not the usual boat stuff. Also, while this setup works for us, and some components might work for you, I probably wouldn’t recommend going out and buying all this stuff to achieve the same thing; a lot of the stuff in this setup is there simply because that’s what we had (for example, I wouldn’t suggest shelling out for a Teltonik RUTX50 router just because it has a GPS module in it). However, you’d almost definitely be able to cobble together a solution based on what you already have available, as well as a few extra components if you so chose.
Below is the list of the broad things we track on the boat:
- Weather
- Position and speed
- Power
- Connectivity
Background
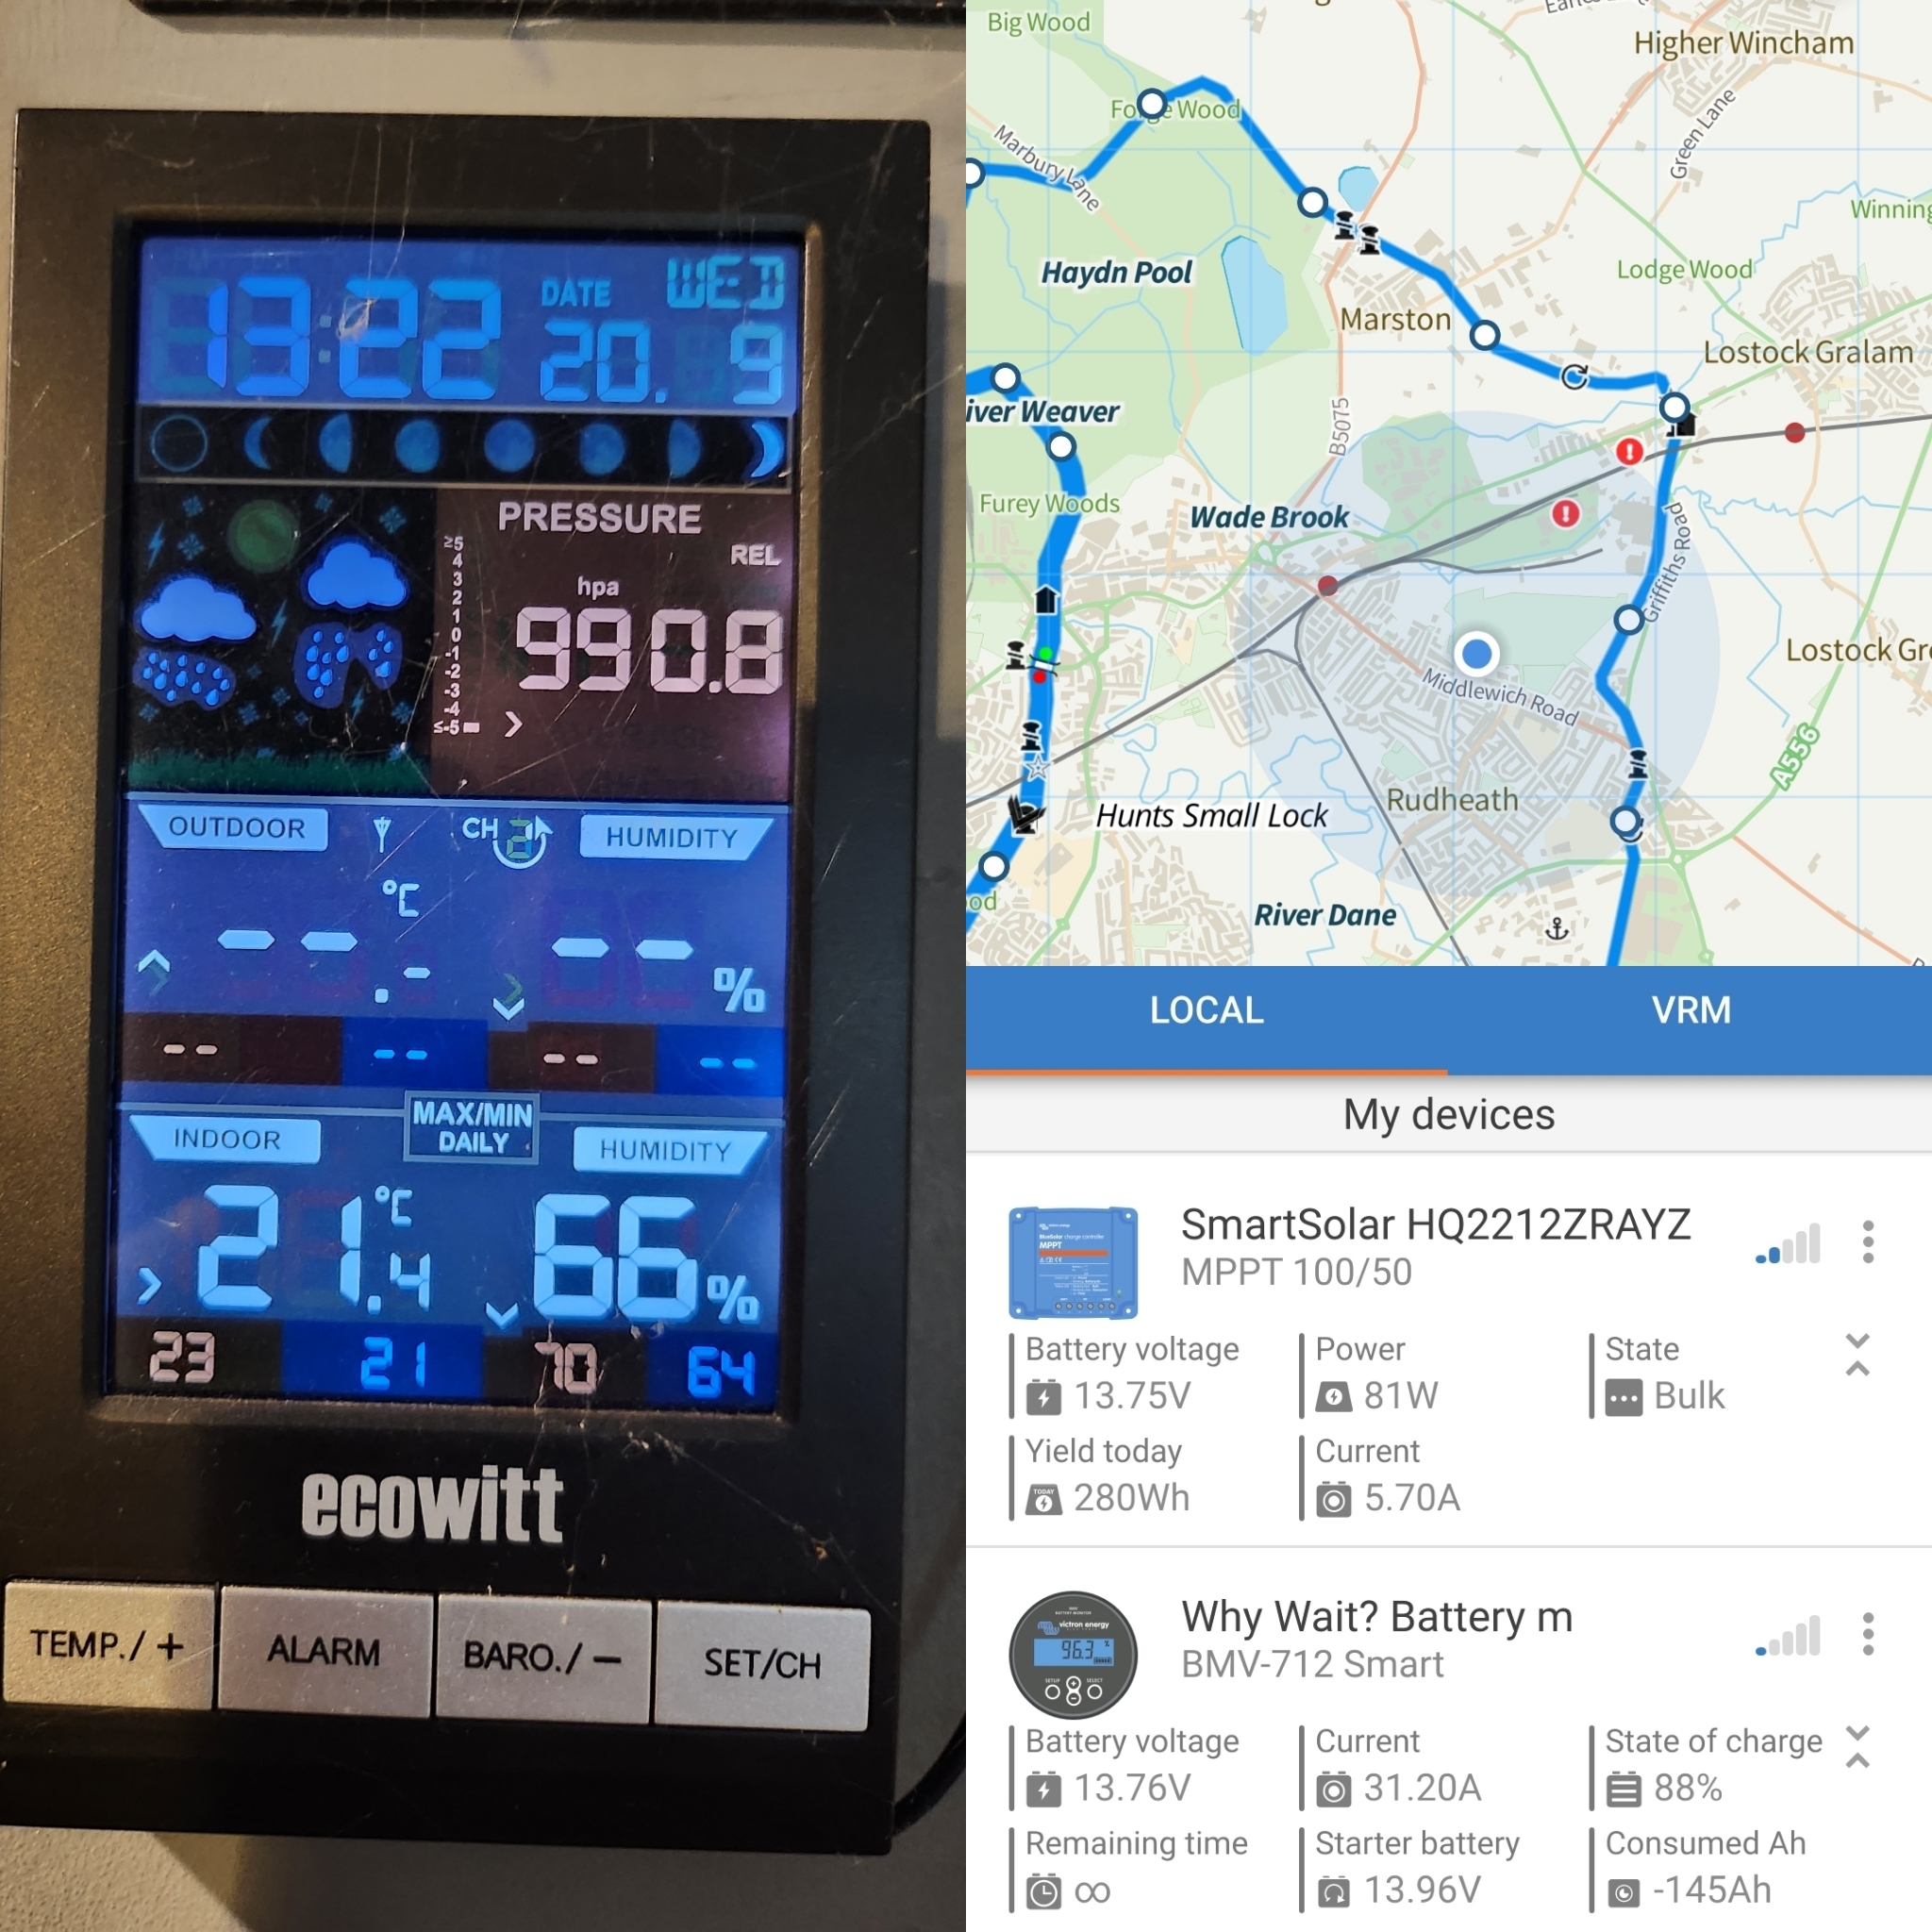
Since getting the boat, we’ve both been interested in being able to track and monitor basically anything that can be tracked and monitored on the boat, be it the current amount of solar input, where we are in the system, strength of the mobile signal, the weather… up until recently, we could somewhat track these things but each using seperate applications, and not at all when we weren’t on the boat ourselves. Both me and Erin come from sysadmin backgrounds, so the concept of live monitoring and reporting is something we’re both very used to.
Having to check the Victron app for power-related things, Open Canal Map for our current position, a wall-mounted weather station for weather information, logging into the router to check signal strength… it was all a bit clunky so I sought to unify everything.
The old, non-unified setup
The main structure of the telemetry system is as follows: Data is collected on a variety of different on-board devices (detailed below). This information gets sent to a Raspberry Pi running SignalK and a little script I wrote to pull connectivity info off my router. The Raspberry Pi then sends the data to a remote InfluxDB server, which is used as a data source for Grafana running on the same remote machine. In Grafana, we can then make fancy looking dashboards with all the stuff collected from the boat. Looks a bit better, I think.
The new hotness
Data sources
Each of the pieces of data we receive come from somewhere. This section will just cover the sources of this data. How we collect it and tie it all together comes later.
Position, speed and networking
We semi-recently purchased a Teltonik RUTX50 router to replace our old Teltonik something in order to add 5G functionality. As a bonus, this also came with a GPS module and antenna. When I initially set the router up however, it was never able to get a fix despite the GPS antenna being mounted on the roof. This issue was resolved by doing a firmware upgrade. There is a slight problem in that roughly once a day, the GPS daemon on the router will stop working. I fixed this by adding a simple entry to the root user’s crontab:
root@Teltonika-RUTX50:~# crontab -l
0 0/6 * * * /etc/init.d/gpsd restart
This simply restarts the GPS service every 6 hours. Problem solved. The RUTX50 supports supplying this information using NMEA to a specified TCP port on a remote device. More on that later.
The RUTX50 can also supply information using a few other standards, such as SNMP and MQTT but to be honest, I could never get MQTT to work properly. I use the SNMP service for pulling information about network connectivity, for example our signal strength in dBm, and whether we’re connected to a tower with 5G or just 4G (as well as data out, data in etc).
Weather
For our weather data, we purchased the Wittboy, an absolutely great little all-in-one weather solution. It actually comprises of two parts - the external weather sensor (WS90) and a gateway (GW2000) inside that receives this information, as well as collecting internal temperature and humidity data. The WS90 is all solid-state - no rotating wind vanes or whatever’s usually used to gauge rainfall and sits very nicely on top of those little magnetic Kuma masts that everyone (ourselves included) seems to use for mounting their mobile antennae. The gateway supports sending the data it gathers to a variety of different weather services, including Wunderground, WeatherCloud, and most importantly for us, a custom-specified remote server.
Power
When we first purchased the boat, we only had a couple of Victron devices - a smart charger for charging the batteries from a 240V power source, and a galvanic diode isolator. Since then, we’ve stuck with Victron and have subsequently purchased an MPPT, a smart battery monitor and an inverter - wouldn’t have bought the inverter but it turns out the old one didn’t like having squash poured into it and gave up its life with a very loud bang. All the Victron stuff can communicate over bluetooth, which is really useful when you’re on the boat and want to know how much power you’re getting from the solar panels, how much power you’re currently using, etc. However, for our telemetry system, we currently only pull information from the MPPT using a VE Direct to USB cable - meaning we can actually only read the solar information and battery voltages using this setup. I’ve not yet looked into pulling it all via bluetooth - there are a few (unofficial) projects that could assist with doing it, I’ve just not checked them out yet.
Collecting the data
Now that I’ve detailed where all this data’s coming from, let’s go into more detail about how it’s collected and turned into something we can send upstream to be remotely available.
SignalK
I found an old SD Card and a Raspberry Pi 4 that I’ve had lying around doing nothing since we moved onto the boat (in its past life, it’s been a NAS and a media server), and got a fresh install of Debian installed on it. Erin mentioned this project she’d seen called SignalK, which is a service that is designed for collecting marine data and unifying it into a single accessible format. Sounds exactly what we want. It has a great list of plugins that we can use for expanding it to do exactly what we want. So, I installed SignalK using their guide for doing so on a Raspberry Pi, which can be found here.
It already had the NMEA functionality installed by default, so in order to start logging our position and speed information from the RUTX50, all I needed to do was point the RUTX50’s NMEA configuration page at it and telling SignalK to run the NMEA server on port 10110.
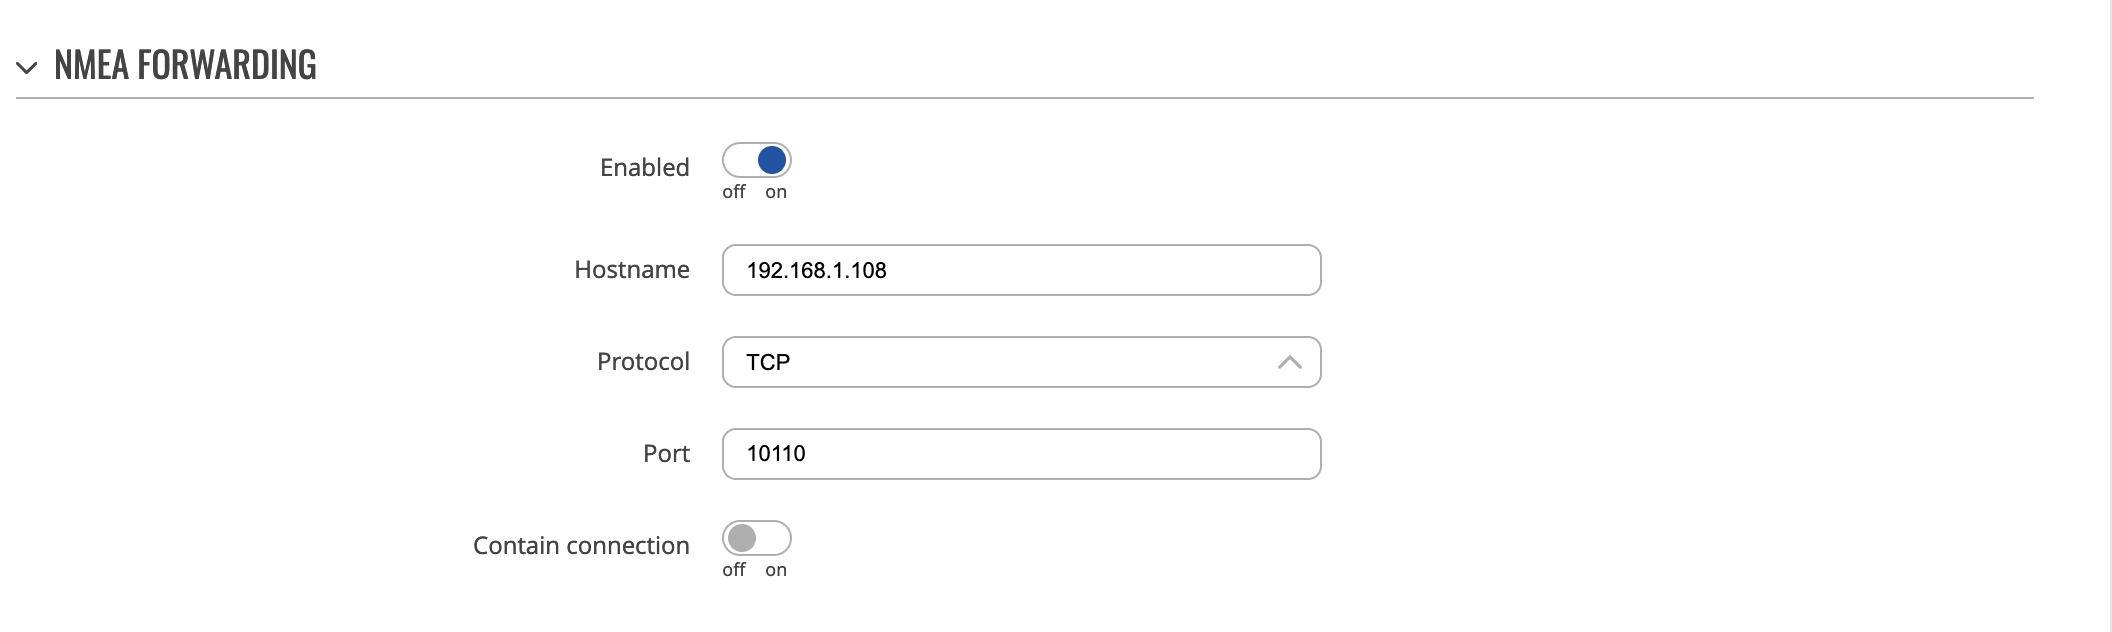
Configuring the RUTX50 to send NMEA data to the Raspberry Pi
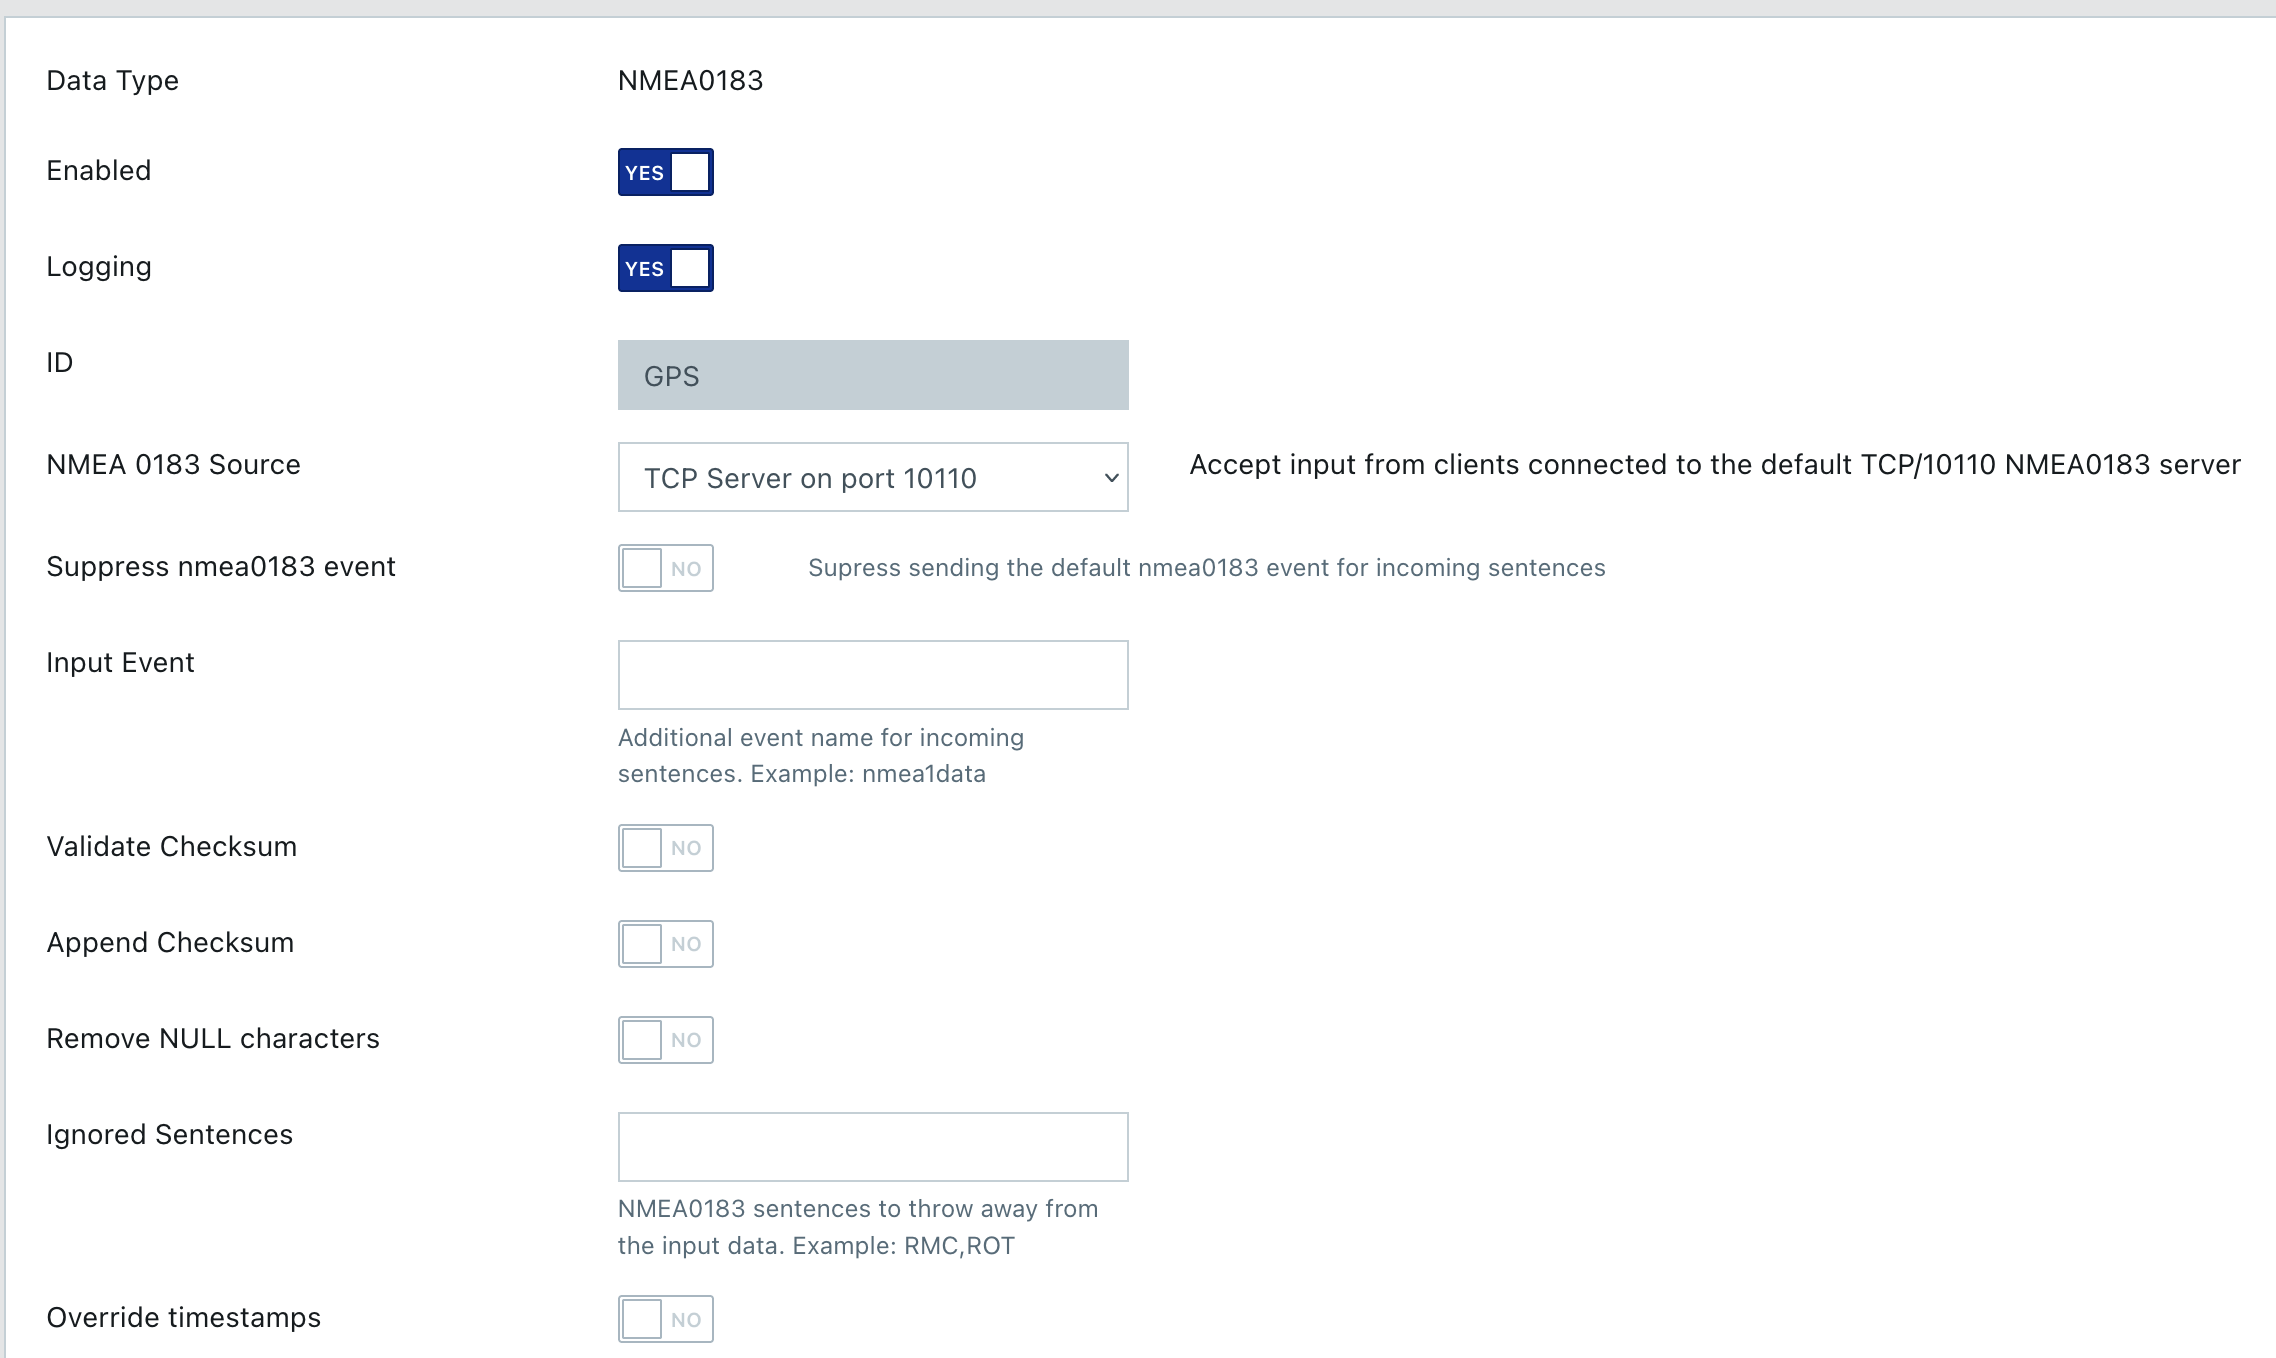
Configuring SignalK to listen on port 10110 to receive NMEA data
There is also a plugin for
receiving data from Ecowitt devices - namely the Ecowitt GW1000. However, it
doesn’t currently have support for the GW2000. There is an open issue for this.
I forked the repository, added GW2000 support and submitted a pull request but
as of writing this post it’s not been merged. As such, you can’t install the
plugin via the SignalK. Instead, to use it, you would need to clone my
repository
here, check out
the gw2000-support branch and link the npm module as per the instructions
here
(just the relevant npm link instructions).
With the signal-ecowitt plugin operational, all I had to do then was point the GW2000 at the Signalk server using the custom section of the weather services page.
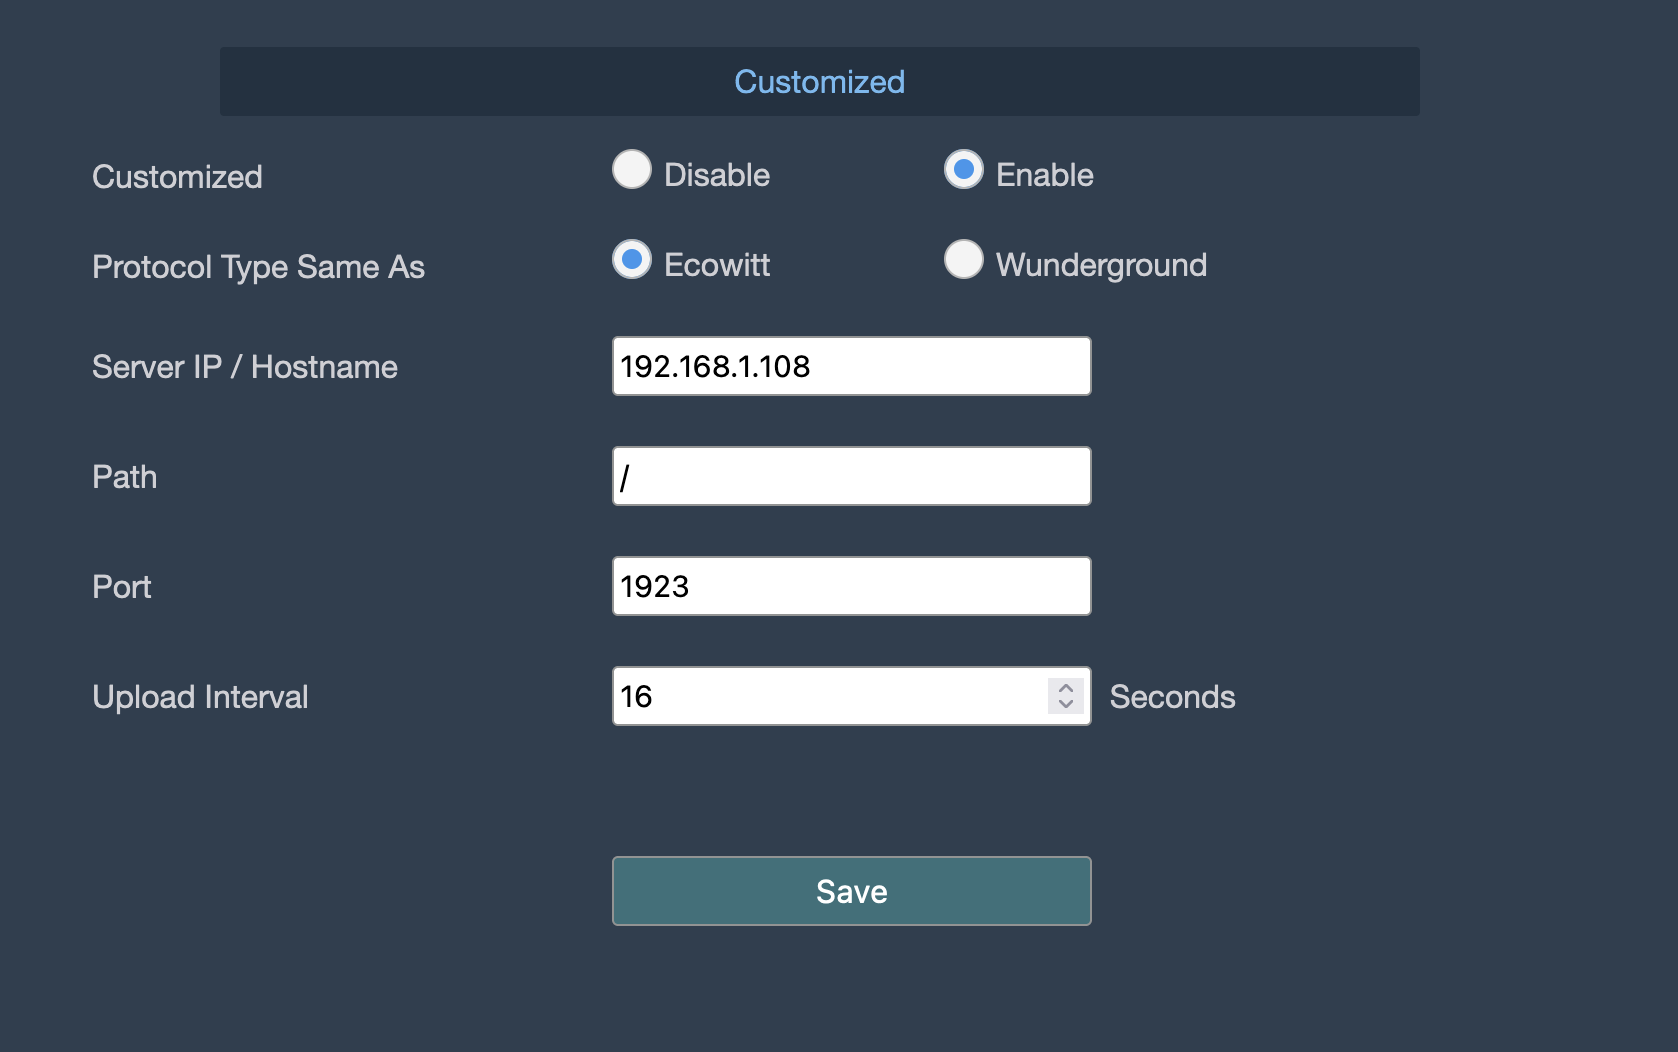
Pointing the GW2000 at the SignalK server
The Victron stuff was even easier! Literally all it required was installing the ‘VE.Direct to Signal K’ plugin in SignalK and connecting the VE.Direct to USB cable between the MPPT and the Raspberry Pi. I didn’t even need to change any settings, it just started working!
InfluxDB
The end goal is to be able to display all this data in set of Grafana dashboards but Grafana needs to have a data source from which it can generate graphs. For this, I’m opting to use InfluxDB for a couple of reasons - one, Erin’s got a fair bit of experience with it and two, there’s an InfluxDB plugin for SignalK. InfluxDB is a ‘time-series’ database - which is to say it focuses on just having data stored as pairs of timestamps and some value at that time. I’m not going to go into the details of how to set up an InfluxDB server here - essentially, I just set up an Ubuntu 22.04 LTS server on Hetzner and followed the instructions for installing and running Influx as a service here. I didn’t bother doing it ‘properly’ with Docker or anything because it’s a personal project and to be honest I kind of missed the joy of just logging into machines, poking around and throwing commands at it.
With Influx configured and running, I could now install the ‘Signal K to InfluxDb 2’ plugin and configure it.
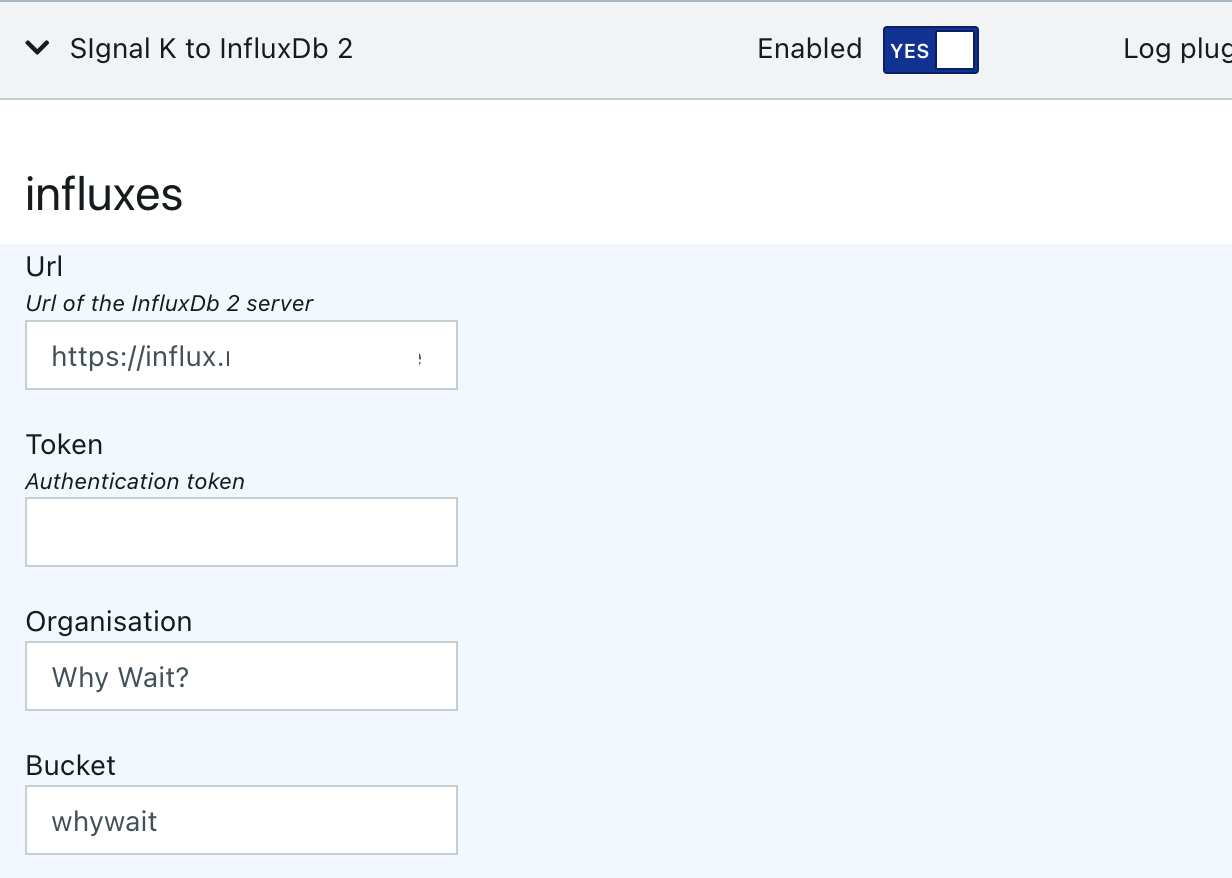
SignalK Influx config
RutSNMP
One thing that we could’t do with SignalK is get the connectivity data from the RUTX50. Despite having a wealth of plugins, one thing it doesn’t have is anything for SNMP support. It apparently has MQTT support but as I mentioned earlier, I had no luck getting that to work. Instead, I wrote a simple little script (which I mentioned earlier) that would manually pull the relevant SNMP OIDs off the router and send them up to Influx directly. The code’s pretty hacky
- each of the OIDs are specified manually with their numeric representation (for
example, the connection type OID is
1.3.6.1.4.1.48690.2.2.1.16.1). This script runs in a tmux session as a bash loop - the looping originally happened in the Ruby script itself but for some reason appeared to have a memory leak and would OOM after a day or so of running. The proper thing to do would be to fix this, and have the thing run as asystemdservice but to be honest, I just couldn’t be bothered.
Displaying the data
We’ve now got just about everything in place - we’ve got our sensors that are measuring data. We’ve got them going to a time-series database that’s externally accessible. The final piece that’s missing is some useful human-readable representation of this data. For that I opted to use Grafana. Pairing Grafana and InfluxDB is quite common, so there’s plenty of information online of how to do it and, again, Erin’s got quite a bit of Grafana experience so she was a great help in setting up the dashboards. As with Influx, I’m not going to go into the specifics of installation - I basically just followed the instructions here. With Grafana installed, we could configure it to use Influx as a datasource, which can just be done via Grafana’s web interface.
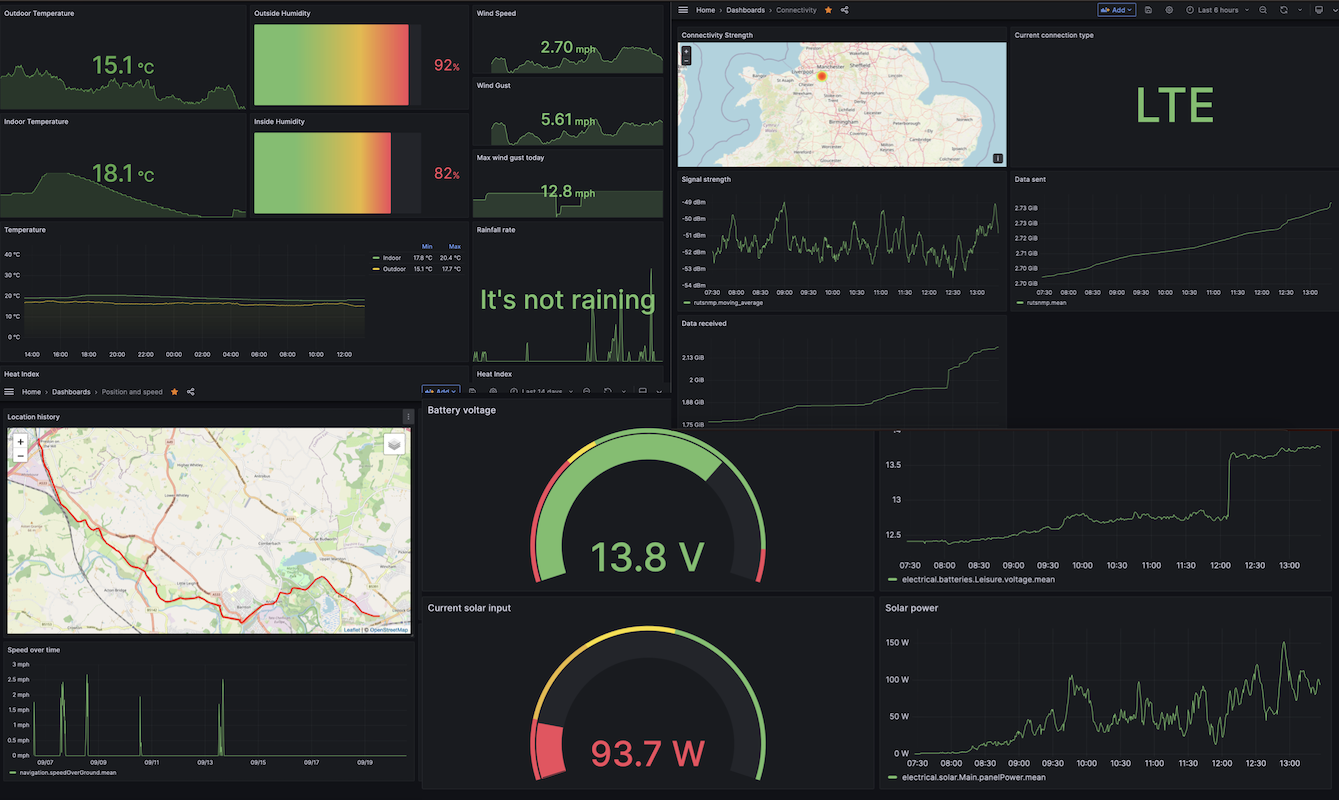
Finally! We’ve got data going from all our sources into something that can create beautiful dashboards. And here’s what they look like!
I’m going to start with probably my favourite - which is the position and speed dashboard.
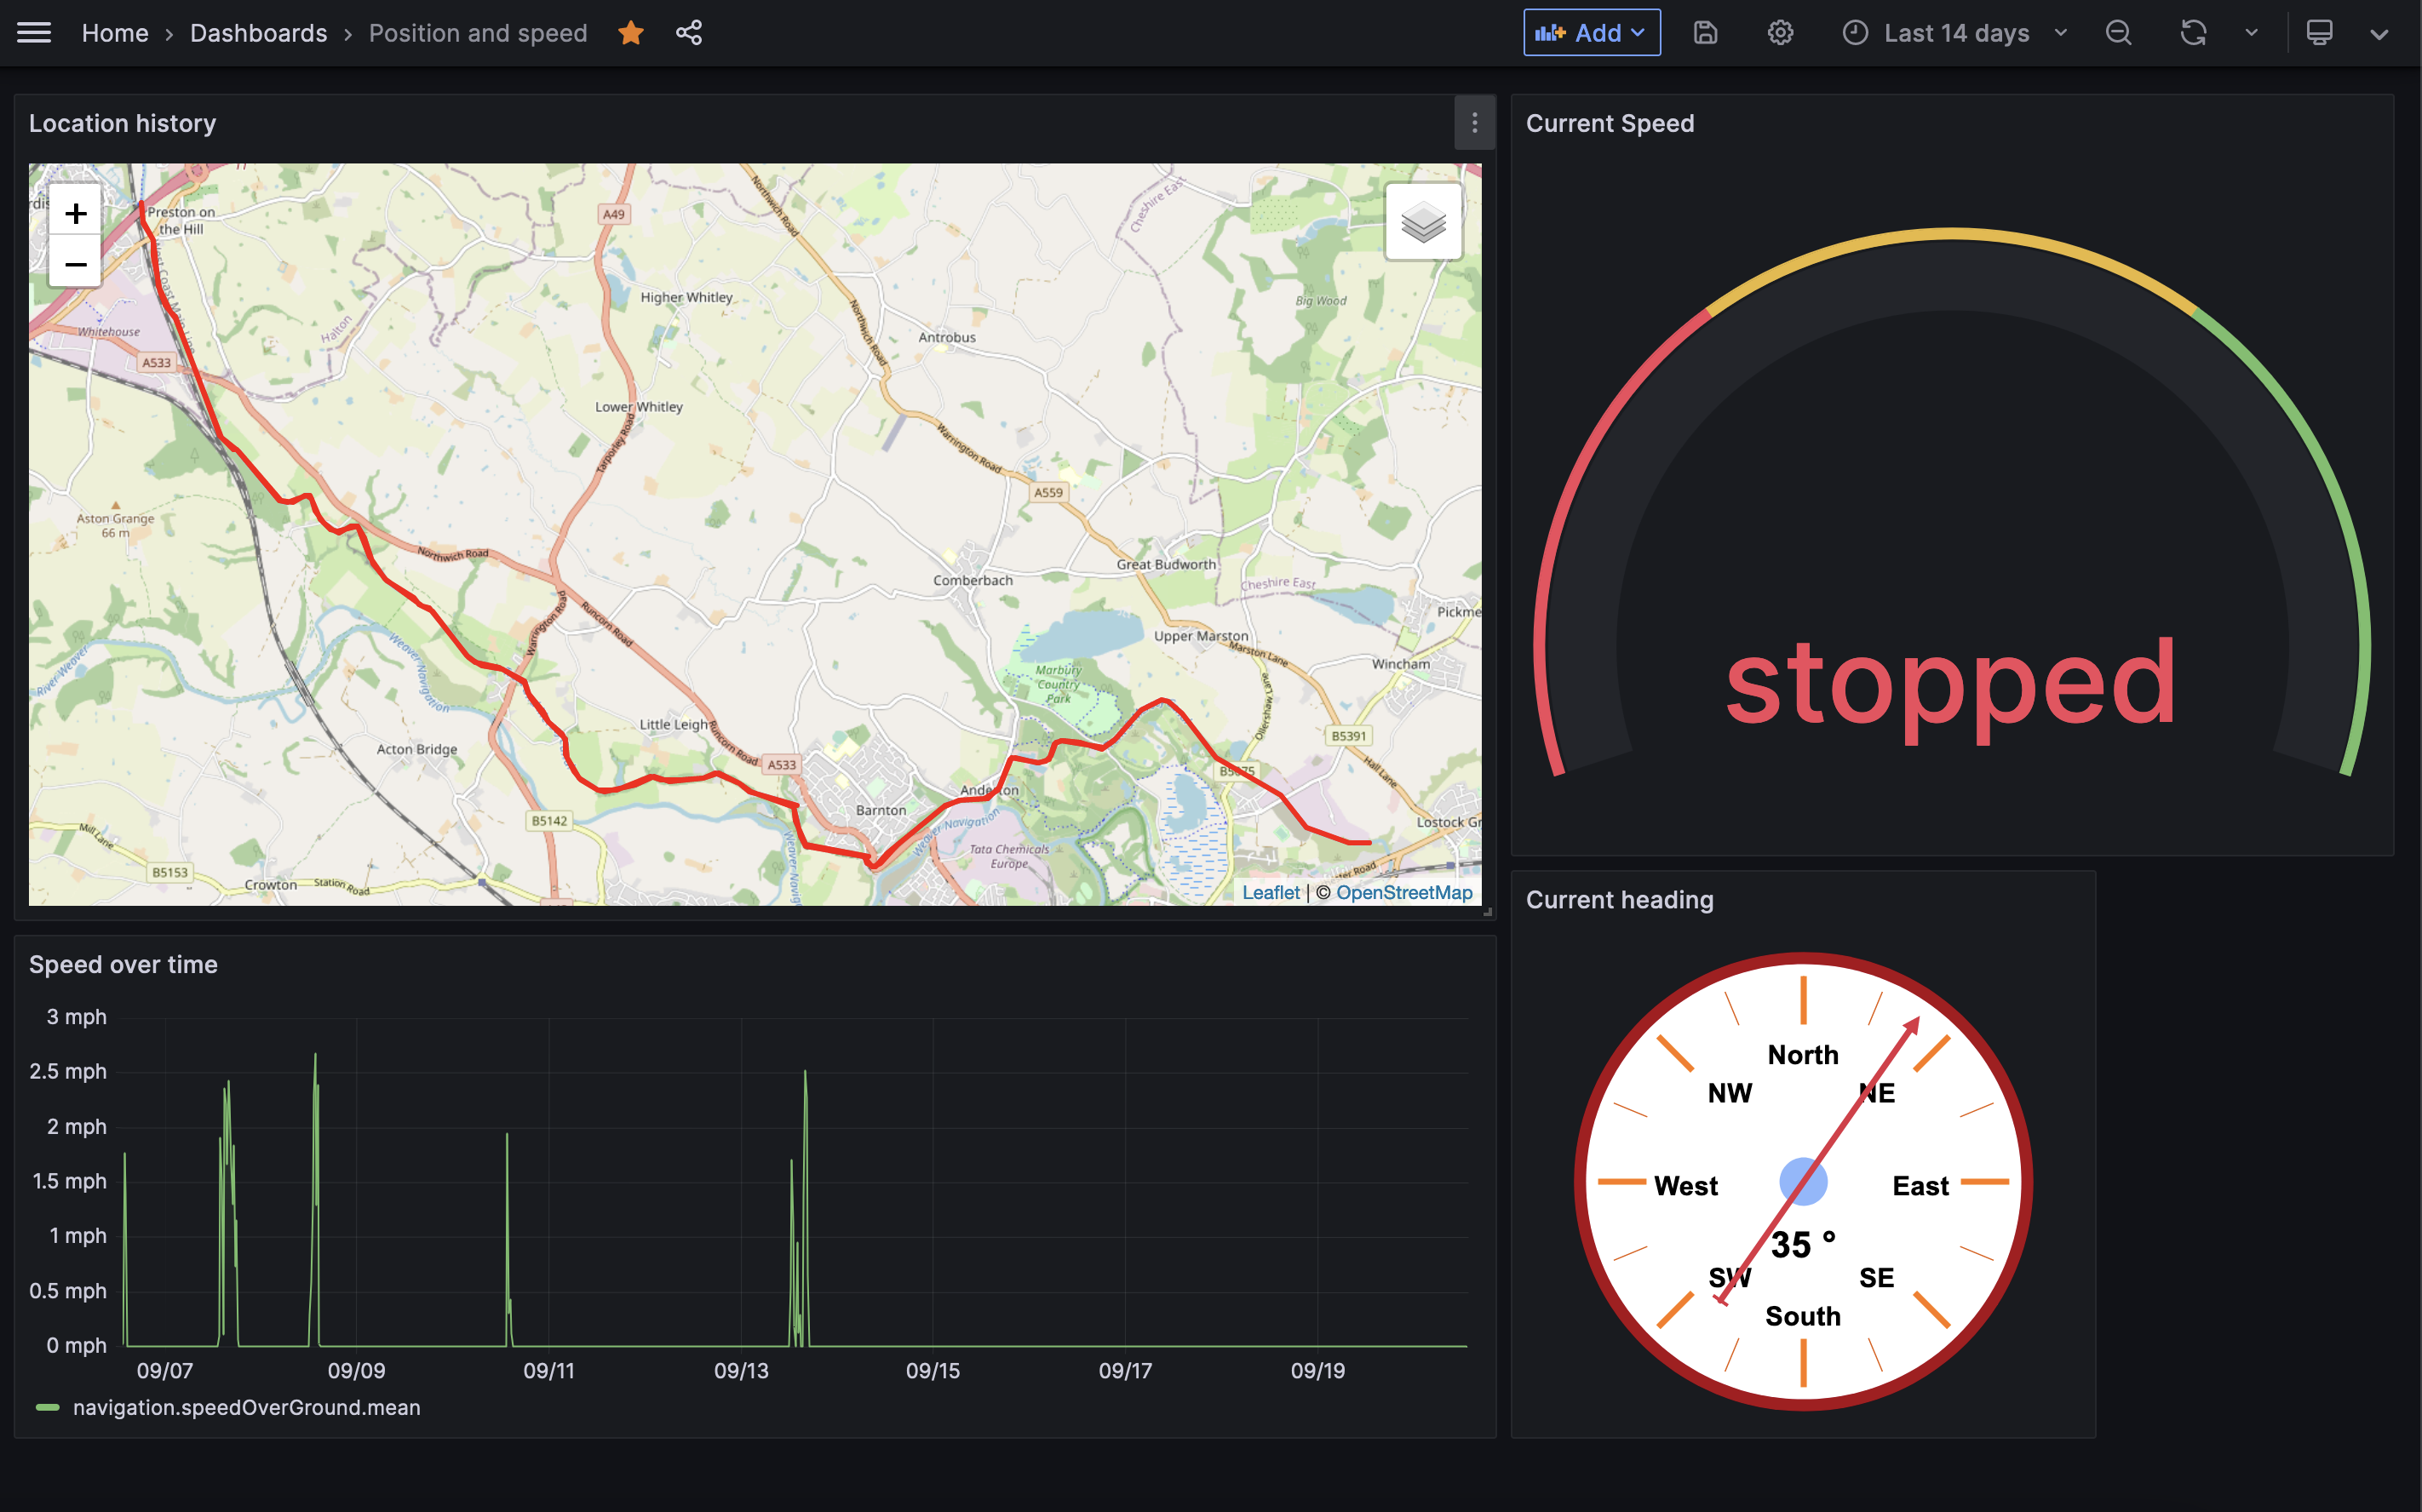
The position and speed dashboard
When underway, it’ll display our current speed (I’ve yet to manage to hit 4mph, but I’ve gotten close!) and the current heading. When stopped, we just use the last non-zero value of the heading since when you’re not moving, you can’t use GPS data to determine your heading. One great thing with this dashboard is selecting different points in time and seeing where you were during that time. It could also, in theory, be used to prove to CRT that you have indeed moved in case you get one of those emails claiming you haven’t (whether they’d listen to your hacked together Grafana dashboard is another matter…).
And if you zoom out all the way (in time), you can see everywhere you’ve been! Here’s everywhere we’ve cruised since I got the thing set up (about 4 months now). During that time, we were stuck on the Upper Peak Forest Canal for a couple of months…
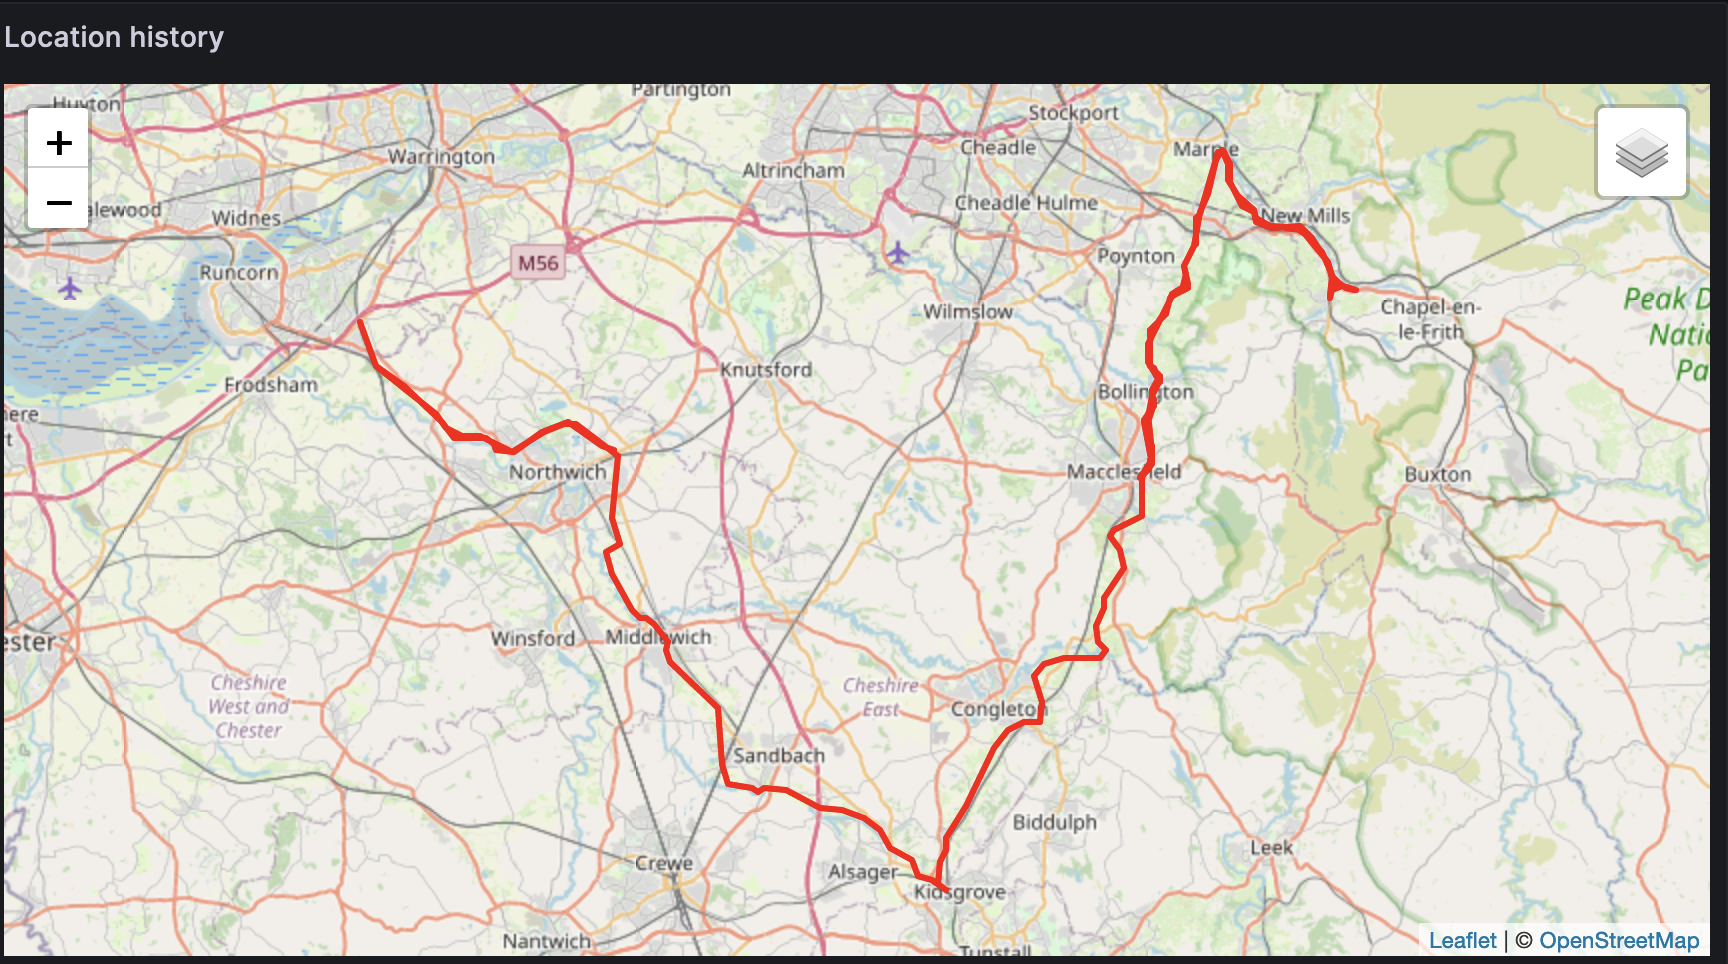
History of our location from the last 4 months
The weather dashboard is another great triumph. With the Wittboy, we get such a wealth of data it took a bit of time to get it all represented effectively. Grafana lets you import dashboards from other people, and I think I did that with this dashboard, but I modified it so much from the original that it doesn’t bear too much resemblance to it anymore. During the very rainy June and July we had, it was great(!) to know that we were getting way more rainfall than those months usually get.
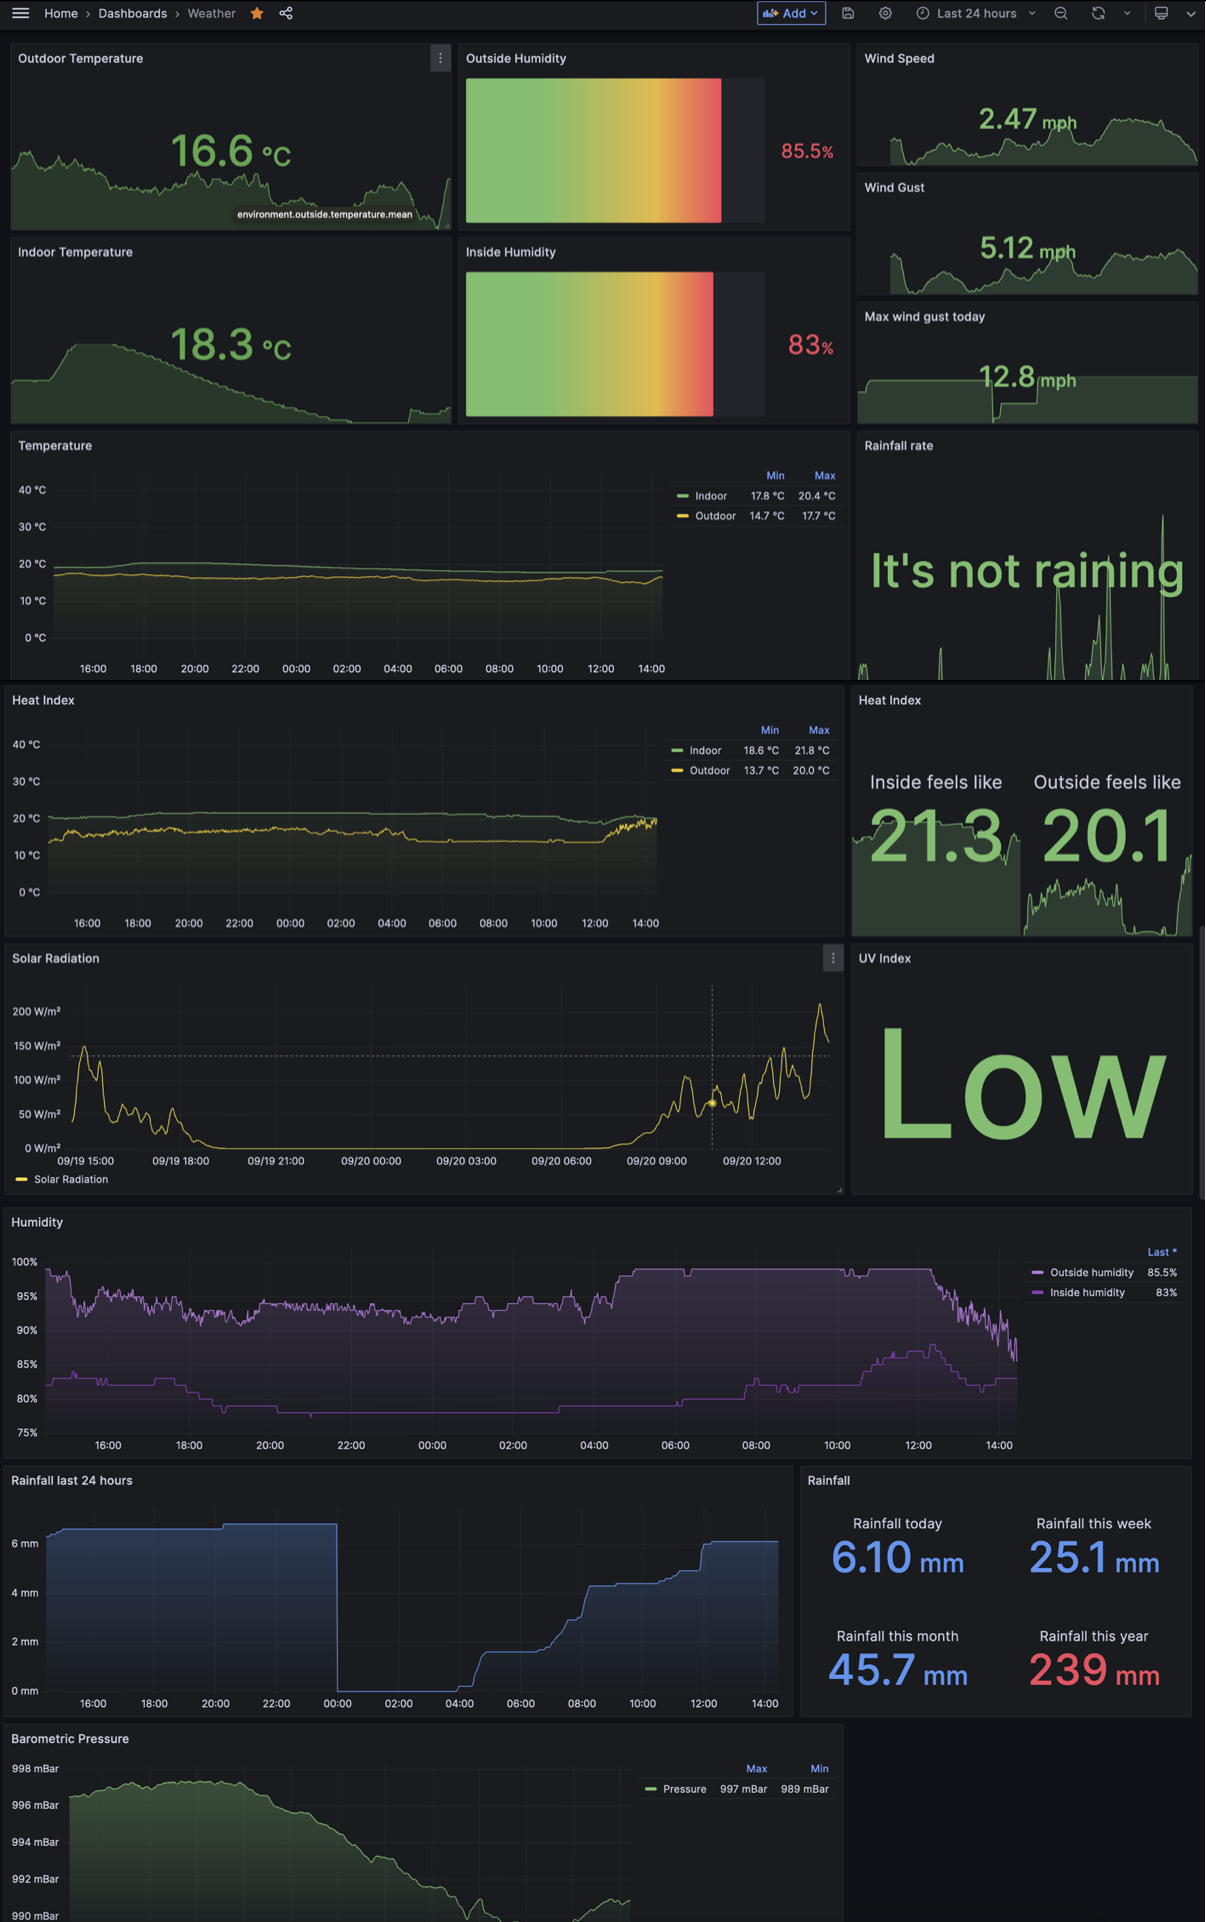
The entire weather dashboard, stitched together cause it’s so big
The connectivity and power dashboards are a little less interesting to look at but are still nice and useful - especially when we’re trying to find somewhere to moor, it’s nice to see how the signal strength changes. We can also cross-reference this with historic location data to try to find good areas to moor so Erin has good enough internet for having meetings, etc. The heatmap in the connectivity dashboard needs work and doesn’t currently represent anything tremendously useful.
As mentioned, with the power, we currently only get information from the MPPT, which includes solar input (wattage, current and voltage), and its readings from the battery - which should be pretty accurate because it’s connected to the SmartGauge via VE.Smart networking.
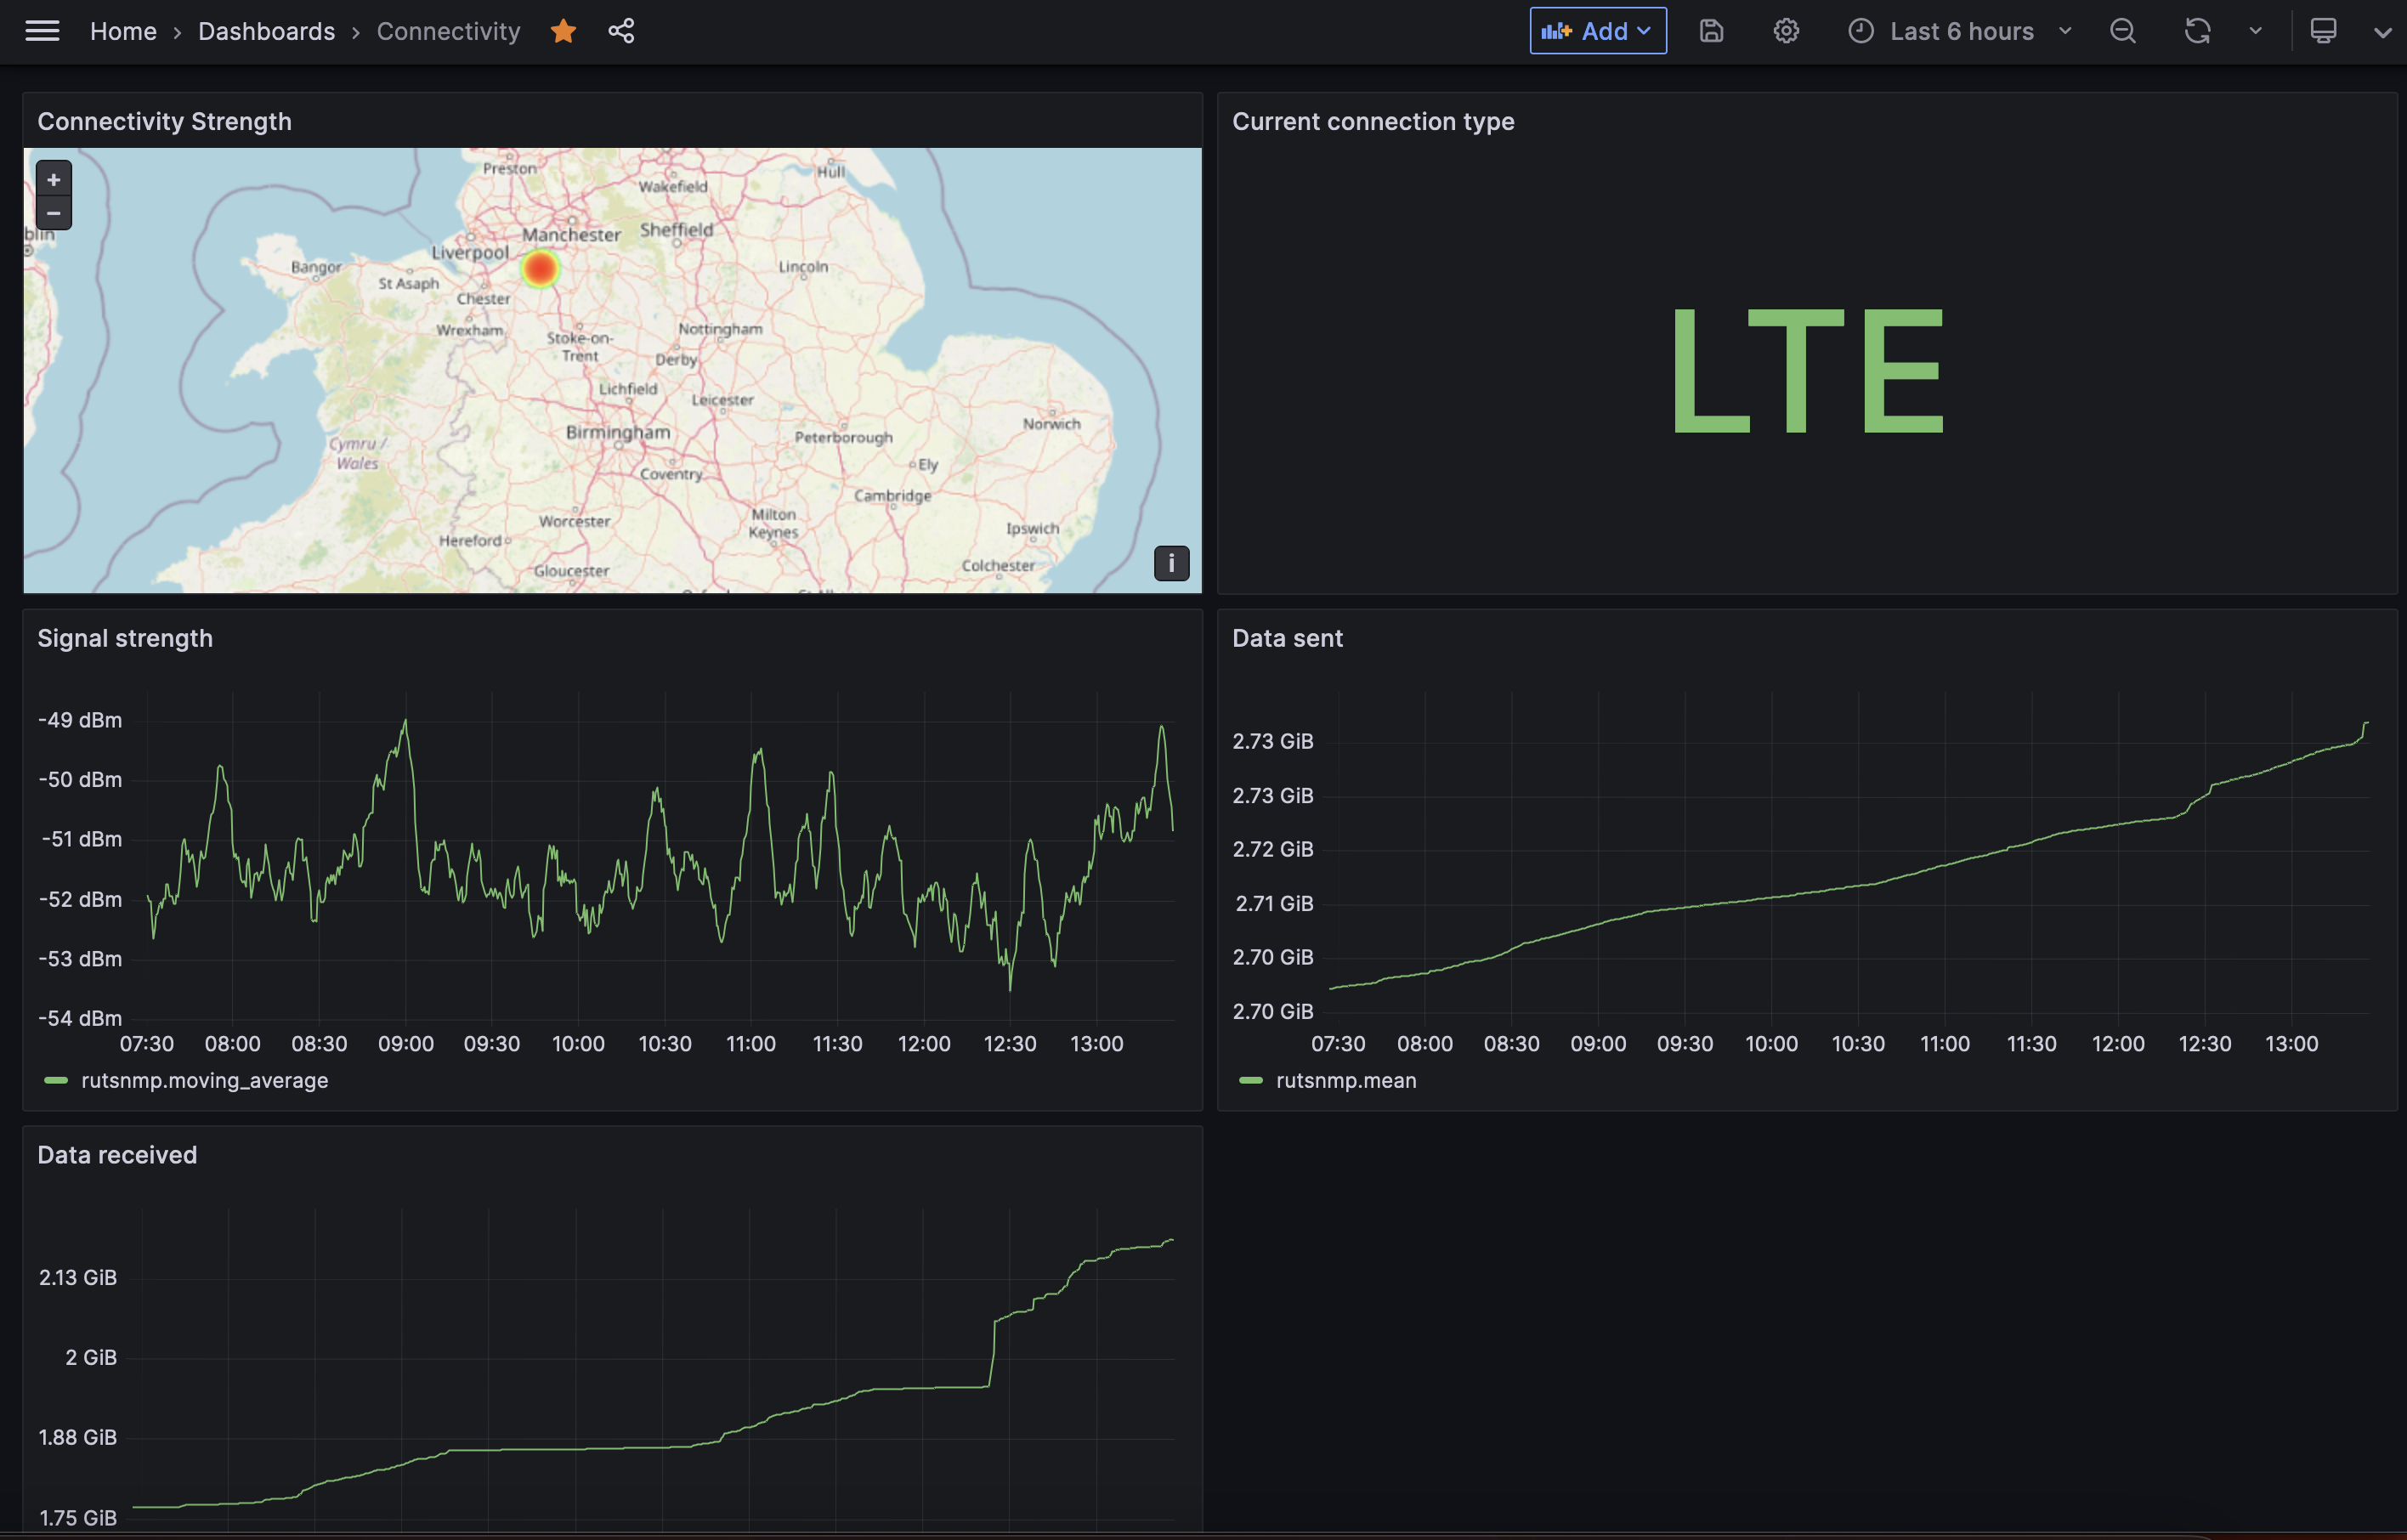
The connectivity dashboard. Sadly, we’ve only got LTE where we’re currently moored
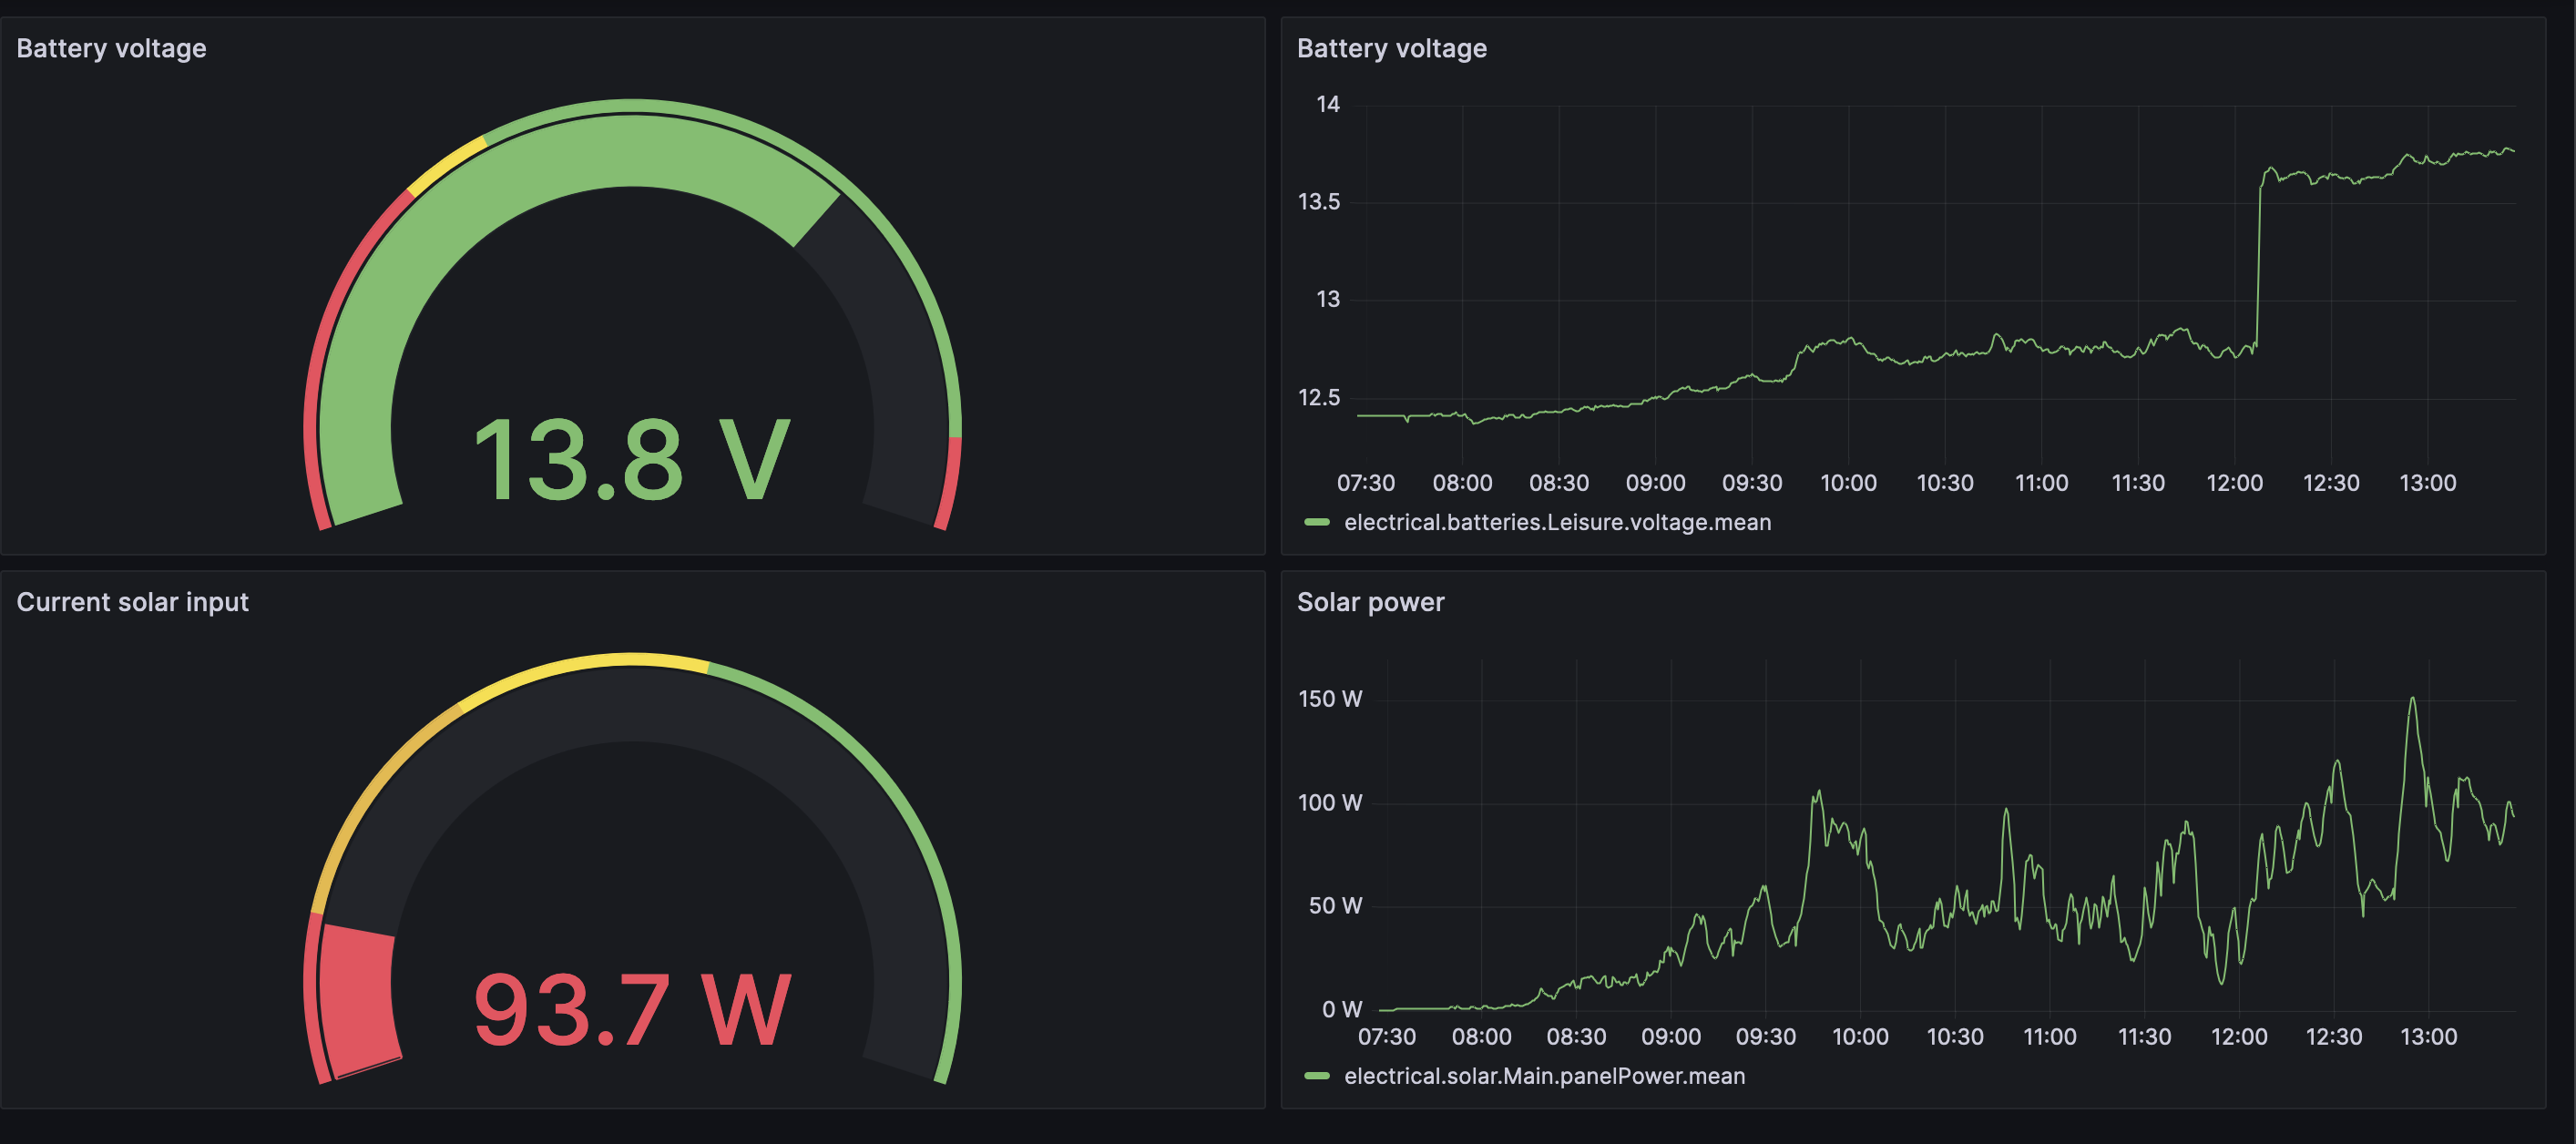
The power dashboard! If you look closely, you can see when I started the engine today
External access
Just one last note before I write some closing remarks - in order for this stuff to be safely externally accessible, I installed the NGINX webserver on the remote server, pointing at Grafana as a reverse proxy. This then allowed me to use Let’s Encrypt to issue SSL certificates.
Access control is simply done through Grafana - there’s an admin account I use for administrating the system, and a couple of read-only accounts that we’ve shared with our families. My mum loves seeing that we’re on the move, asking where we’re heading and reminiscing about her and my Dad’s time in those areas.
Closing remarks
This post’s been a bit all over the place in the sense that in some areas I probably went into too much detail, and glossed over some things. But I hope it serves to show that it’s possible to clobber together a bunch of different technologies and create a nice little solution. Since leaving my job in tech over a year ago, it’s been fun to do system administration and service deployment again, using a couple of technologies I wasn’t that experienced with.
And one remark about using this to track your boat movements - since setting up this telemetry service, I’ve been made aware of two separate projects being developed to log your location on the network.
These are much easier to get set up with than this beast I’ve put together, but don’t really support continued logging of your location (as well as everything else). Drift Diary works by using the location data embedded in photos to determine their location, while Float has you announce in the app when you have left and arrived in order to track your movements. While they’re only semi-related to this post, I still thought they were worth mentioning.
Cheers, and until next time!